Supply and demand are fundamental concepts that shape the behavior of human psychology within a marketplace. Supply and Demand (S&D) allow investors and traders alike to make better decisions in the financial markets. By understanding S&D, you will be able to better evaluate what the price of an asset is relative to its fair price.
In this article, we will explore:
- The concept of supply and demand
- Importance of the equilibrium price
- A supply and demand and volume profile comparison
- How to determine the fair price of an asset
Let’s dive right in.
Understanding Supply and Demand
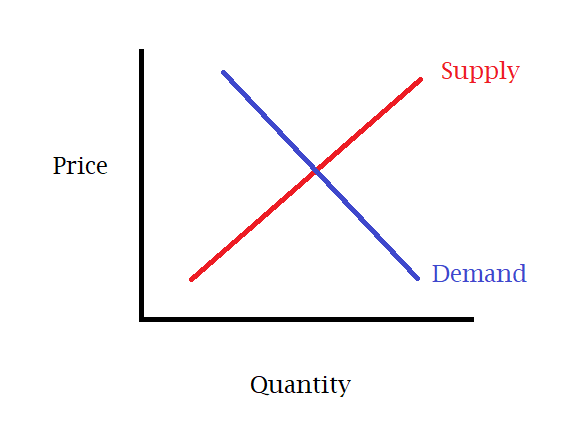
The graph layout has price on the Y axis and quantity transacted on X axis. The Supply represents the quantity of a particular asset available in the market at a given price level. Demand, on the other hand, signifies the amount of that asset desired by buyers at a specific price. On the graph below we can see that as the price increases the demand decreases. This is because buyers are always looking to buy at the lowest price. Supply on the other hand increases with price because sellers want to sell for the most possible profit. The intersection of the supply and demand line makes the equilibrium price.

In some cases supply and demand functions are curved and not linear but on the above graph they have been placed as linear for simplicity.
Equilibrium Price
Now that we understand how the graph for S&D looks like we can start interpreting the information it gives us. The equilibrium price is where the forces of supply and demand are balanced at the intersection. At this price buyers and sellers transact to make the most amount of possible transactions. At this price, the market clears, meaning there is no excess supply or demand. Any changes in supply or demand factors can disrupt the equilibrium and lead to price adjustments.

Comparing Supply and Demand to Volume Profile
Volume profile analysis is a technique used by traders to analyze the volume traded at different price levels. It provides insights into the distribution of trading activity within a given period. Volume profile helps identify price levels where significant buying or selling pressure exists. [Link to volume profile]
When comparing supply and demand dynamics to volume profile analysis, it’s important to note that they provide similar information. Supply and demand focus on the relationship between price and quantity exchanged of a certain good, while volume profile sheds light on the intensity of trading activity at specific price levels. Both graphs have price on the Y axis and quantity on the X axis meaning the information is very similar.

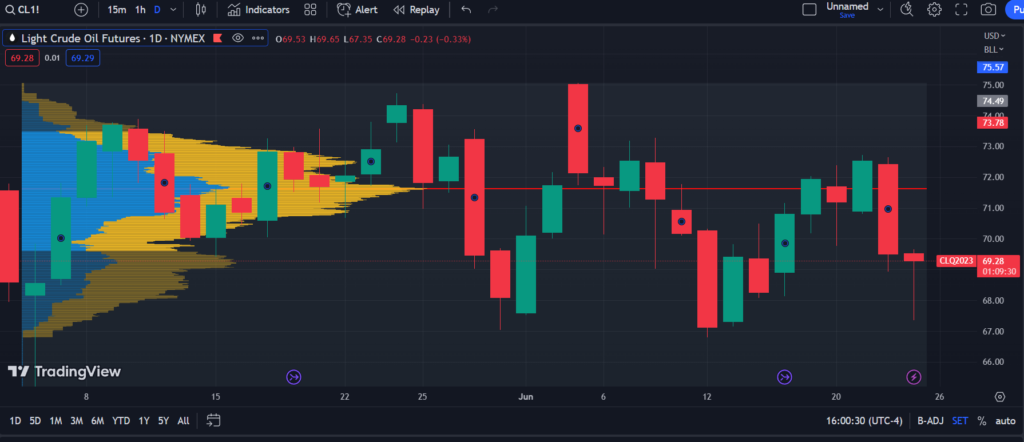
This is a volume profile chart from crude OIL from May 2023 to June 2023. We can see that both charts have downward slopping demand curves, upward sloping supply curves and an equilibrium price in the center.
How to determine the fair price of an asset
In supply and demand the most amount of transactions happen at the equilibrium price. In volume profile analysis, a higher volume transacted at a particular price level indicates a high volume node. When comparing these two it is apparent that the equilibrium price in S&D is the same of the high volume node in the volume profile. This means that the price where the most transactions took place is the equilibrium price in a financial market. If the goal is to buy low and sell high you would need to transact at prices other then the equilibrium which is the fair price of an asset. More information can be found on this on my article on volume profile [link]. It is also important to note that not all markets are balanced and there exists many types of markets [link] with different supply and demand curves. It is important to know where equilibrium is to have a better understanding of the market but it is not enough on its own to fully analyze the market.

Conclusion
Supply and demand are factors that affect price movements in financial markets. The equilibrium price, determined by the price where the most amount of transitions occur, represents the fair value at which buyers and sellers agree. Volume profile analysis provides insights into the distribution of trading activity and helps identify price levels where significant trading volume has occurred.
A higher volume transacted at a specific price level indicates a fairer price as it reflects the collective opinion of market participants. By understanding supply and demand dynamics and incorporating volume profile analysis, you can gain valuable insights into market sentiment and make more informed decisions.
As market participants continue to analyze supply and demand dynamics and delve into volume profile analysis, they can navigate the markets with a deeper understanding of the underlying market dynamics and potentially identify favorable trading opportunities.
Just remember to always manage your risk while doing so,
Let me know what else you would like to learn and follow for more.
Cheers,
Andrew Akl
WealthGrasp.com adheres to strict editorial integrity standards. To the best of our knowledge, all content is accurate as of the date posted, though offers contained herein may no longer be available. The opinions expressed are the author’s alone and have not been provided, approved, or otherwise endorsed by our partners.Information provided on WealthGrasp.com is for educational purposes only. Your financial situation is unique and the products and services we review may not be right for your circumstances. We do not offer financial advice, advisory or brokerage services, nor do we recommend or advise individuals or to buy or sell particular stocks or securities. Performance information may have changed since the time of publication. Past performance is not indicative of future results.


